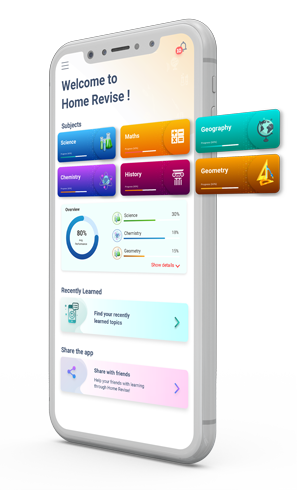
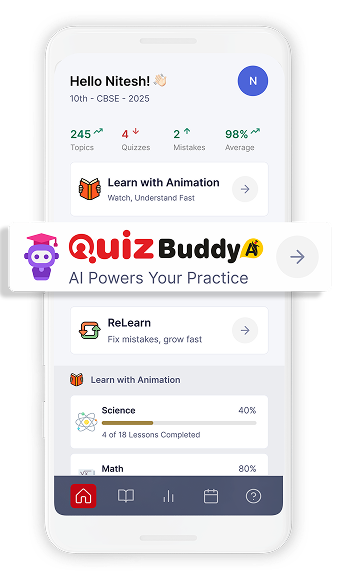
HomeRevise makes learning faster and smarter with syllabus-aligned animated lessons and AI-powered quizzes that fix mistakes and boost confidence.

With top ratings and thousands of learners, HomeRevise is making study simple and powerful.
Animated lessons, smart quizzes, and ReLearn challenges turn every study session into a game you can win.

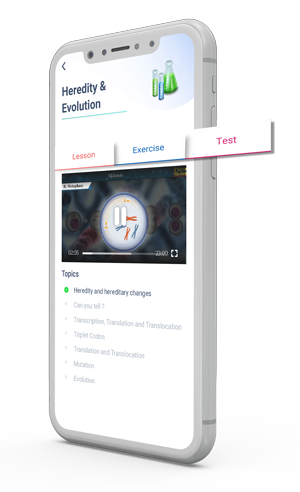
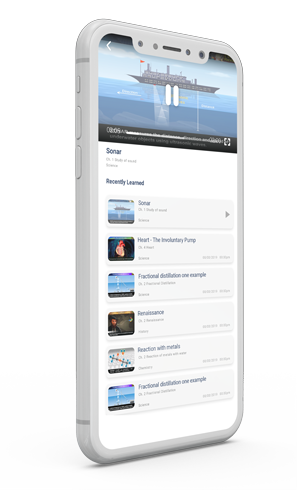
Complex topics explained visually so students understand faster and remember longer. Animated lessons simplify tough concepts, helping students understand faster and remember longer.
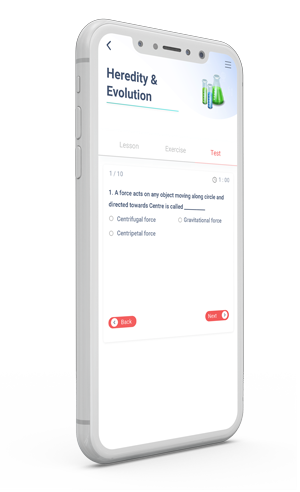
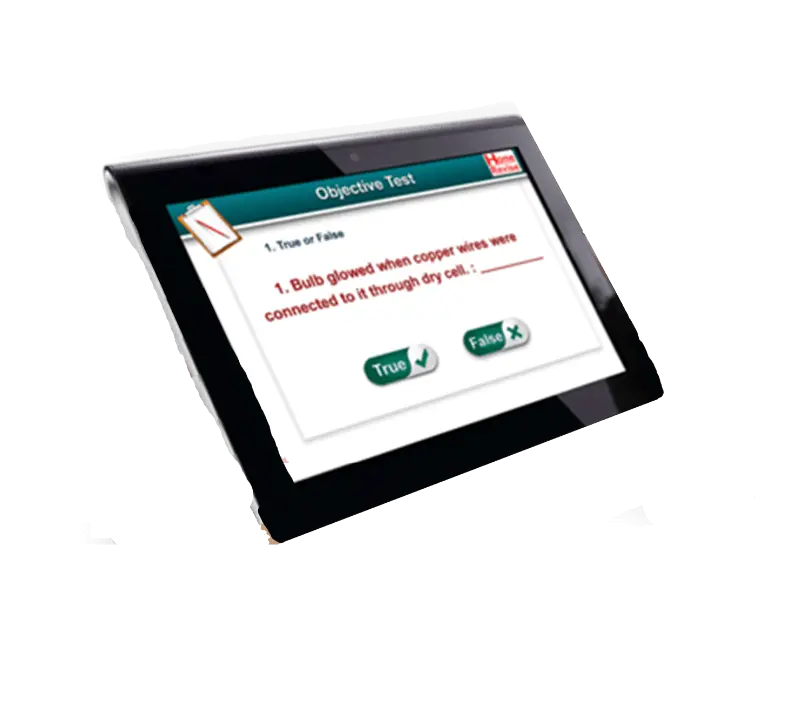
Personalized quizzes created from your progress and mistakes. Practice smarter every day, fix weak spots, and score higher.

ReLearn captures mistakes from quizzes and turns them into practice. Every error becomes a chance to improve and boost confidence.
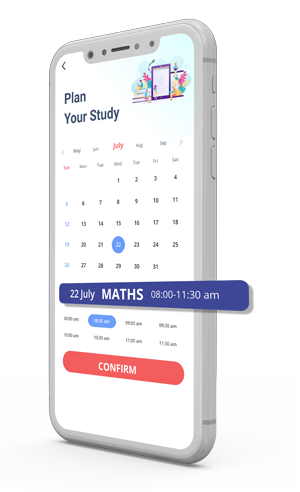
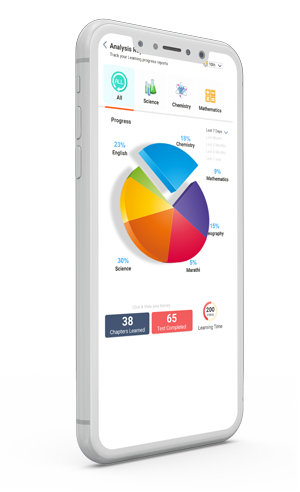
See your progress in real time and keep your motivation high. Track milestones, celebrate achievements, and stay inspired as you move forward. With clear insights and encouraging reminders, reaching your goals feels more rewarding every step of the way.